![]()
dNation Kubernetes Monitoring
![]()

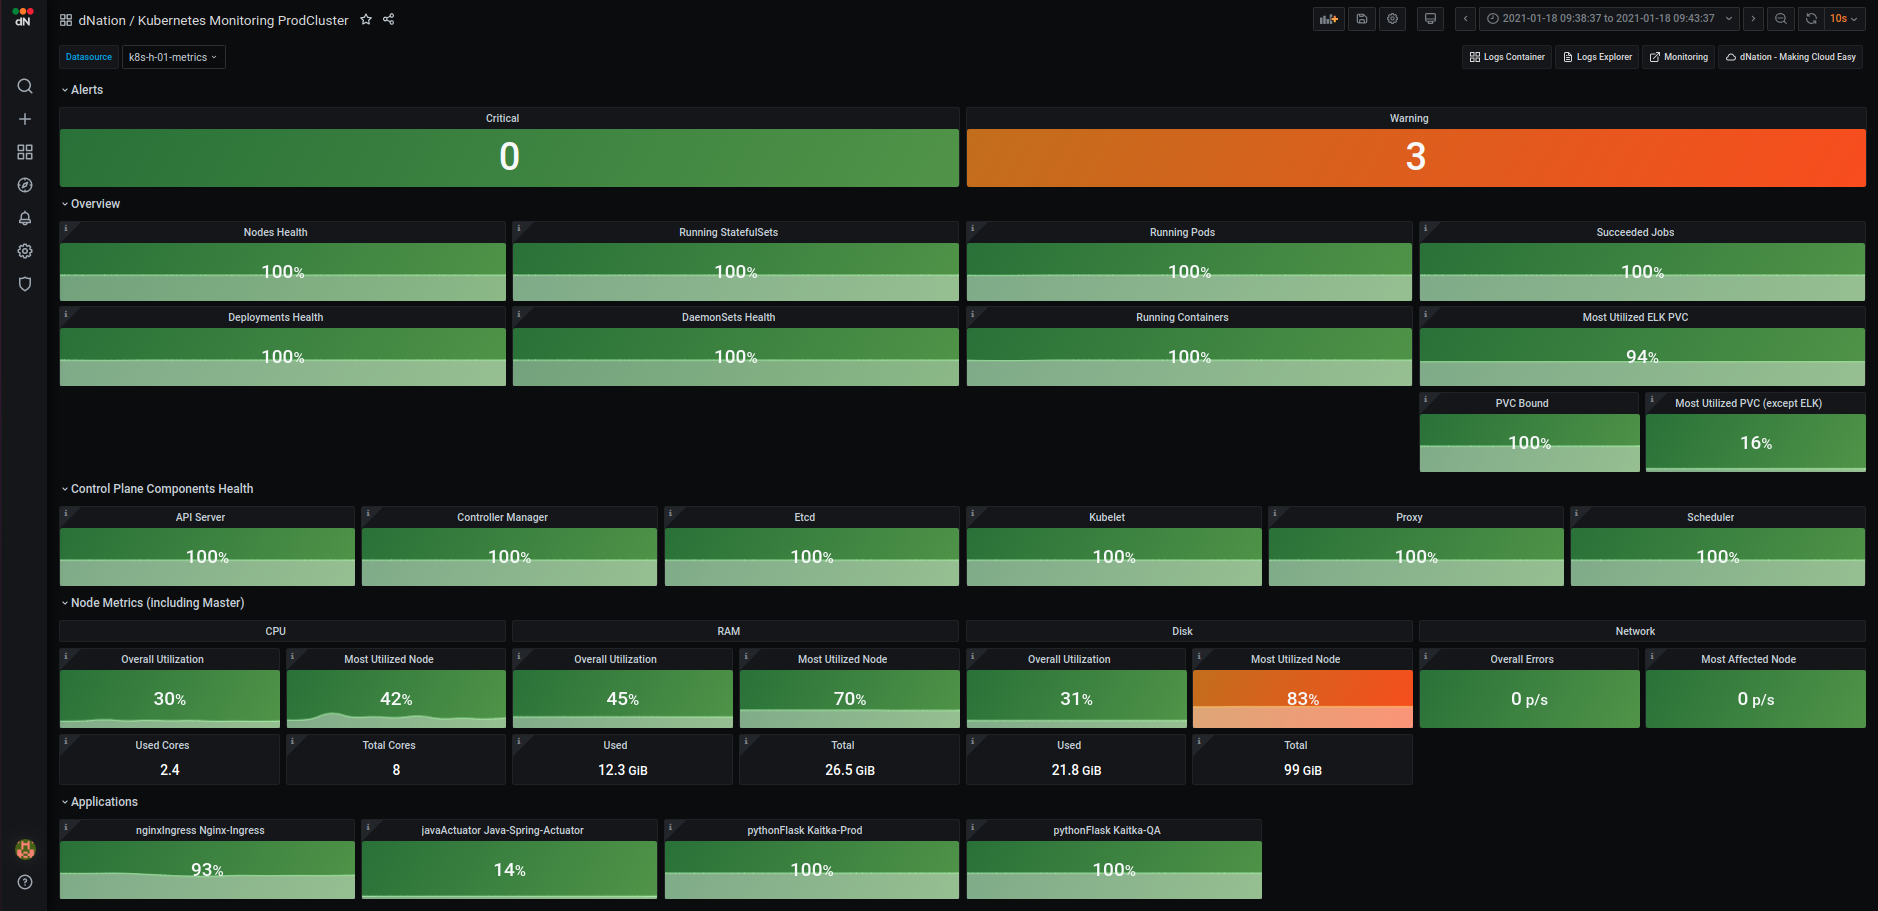
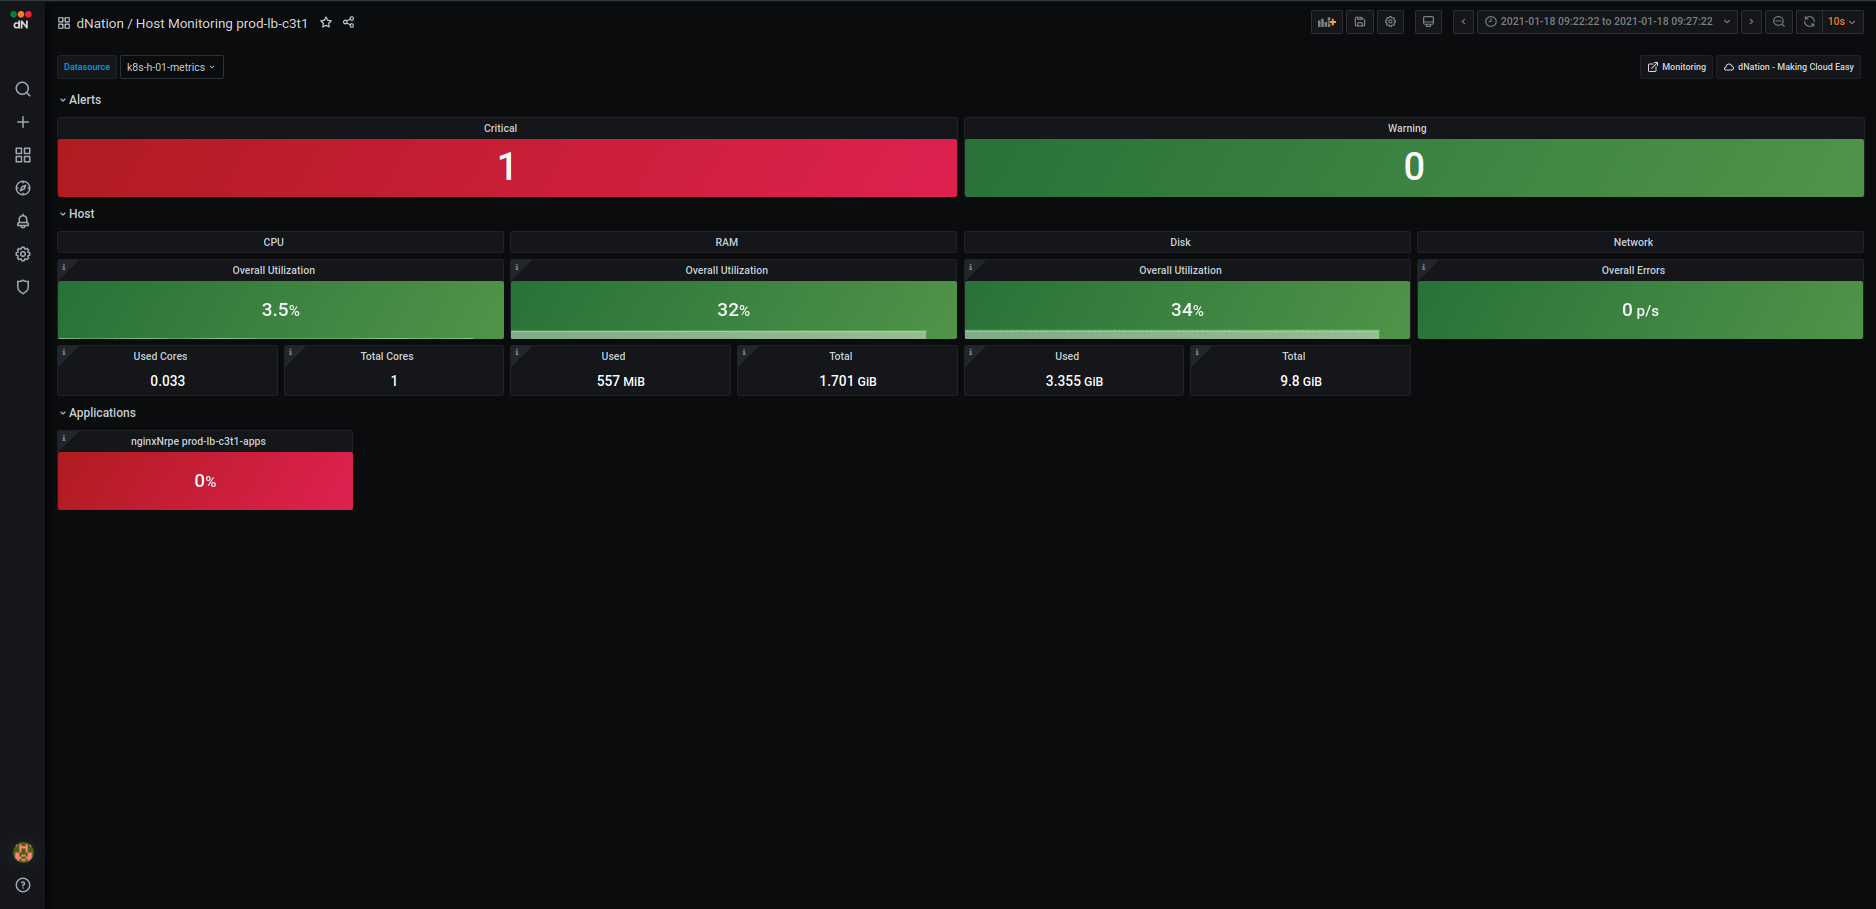
See status of your Kubernetes infrastructure and applications at a glance using semaphore (green/orange/red) principle:
![]()
It is a set of Grafana dashboards and Prometheus alerts written in Jsonnet. This Monitoring also supports multi-cluster monitoring by Thanos and following 3 basic design principles:
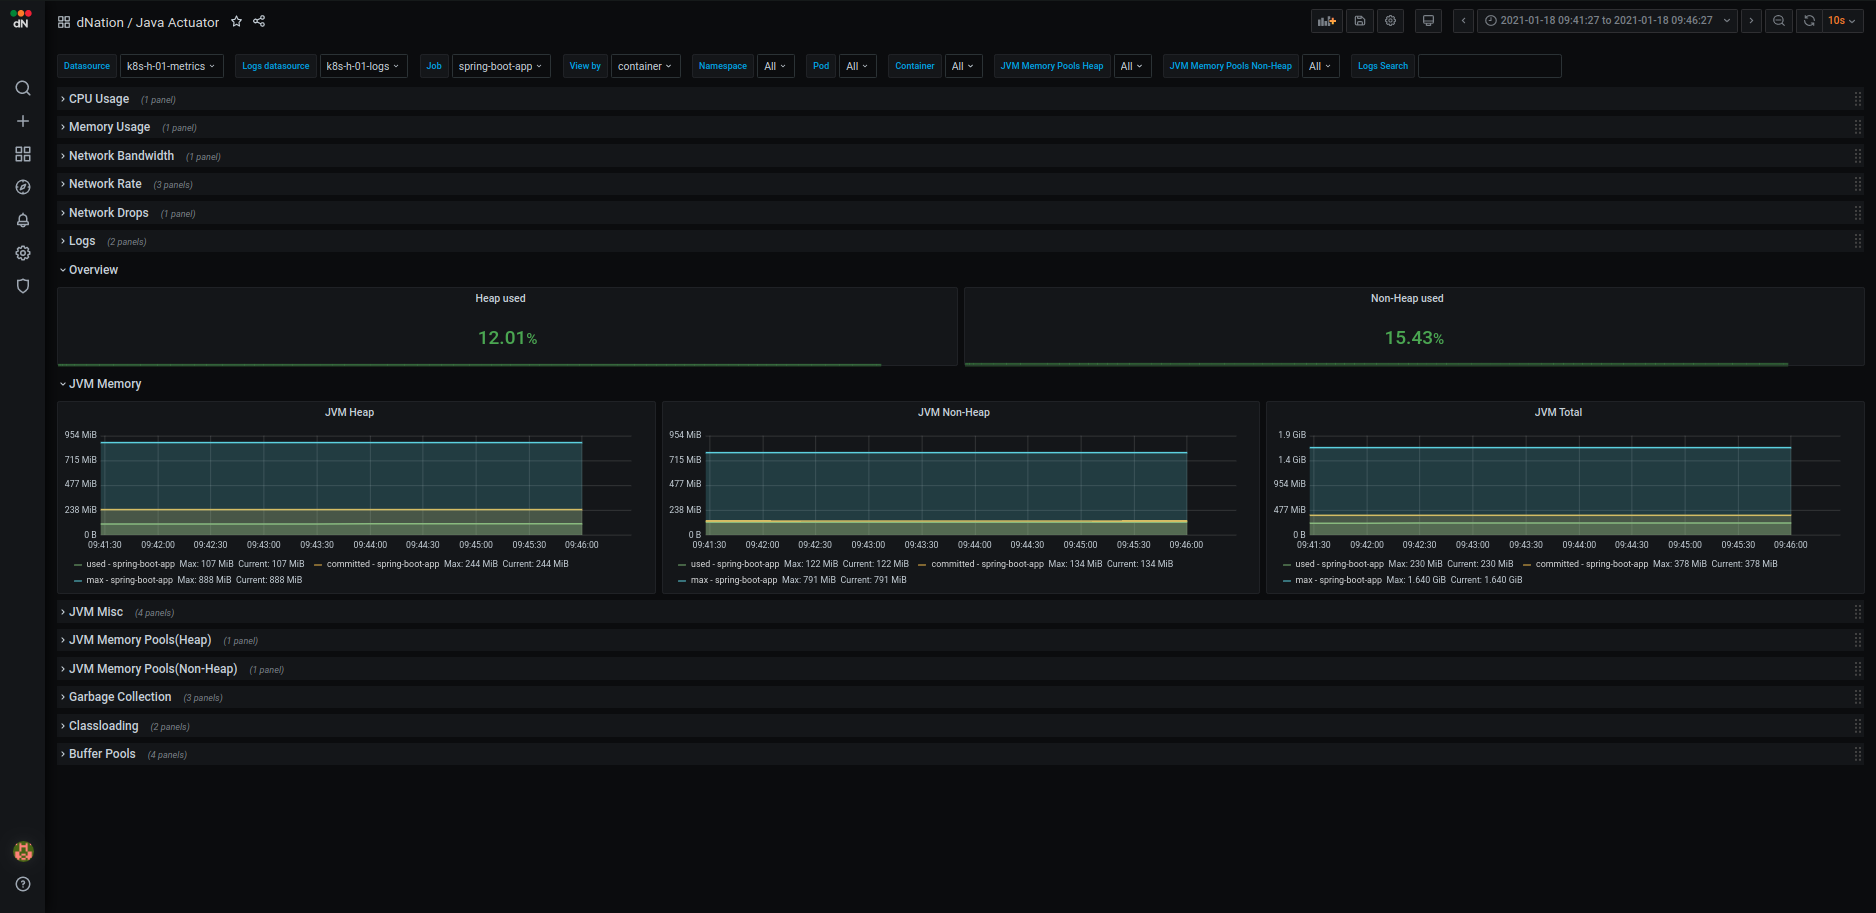
Intuitive- Green, orange and red colors signaling whether or not your action is neededDrill-down- if you want details why something is green, orange or red, just click itRelevant information only- provide only metrics relevant for this particular area of interest and drill-down level, side-by-side with logs (experimental feature)
Monitoring targets are:
| Kubernetes | Hosts | Applications |
|---|---|---|
 |
 |
 |
Full Installation
In case your current Kubernetes installation doesn't contain Prometheus Operator, Grafana or Loki, please install dNation Kubernetes Monitoring Stack helm chart (recommended).
Dashboards and Alerts only Installation
In case your current Kubernetes installation already contains Prometheus Operator, Grafana and Loki, please follow here.
Documentation
See the documentation and FAQ for further information.
Contribution guidelines
If you want to contribute, please read following:
- Contribution Guidelines
- Code of Conduct
- How To simplify your local development
We use GitHub issues to manage requests and bugs.
Commercial support
This project has been developed, maintained and used in production by professionals to simplify their day-to-day monitoring tasks and reduce incident reaction time.
Commercial support is available, including 24/7, please contact us.